Healthcare Analytics
This dashboard provides a comprehensive operational view of Emergency Room performance, focusing on patient volume, wait times, admissions, demographics, and service efficiency.
KPI Requirements:
- Number of Patients:
- Measure the total number of patients visiting the ER daily.
- Display a daily trend using an area sparkline to understand patterns over time, such as peak days or seasonal trends.
-
Average Wait Time:
- Calculate the average time patients wait before being attended to by a medical professional.
- Use an area sparkline to show daily fluctuations and identify days with higher wait times that may require operational adjustments.
-
Patient Satisfaction Score:
- Analyze the average satisfaction score of patients on a daily basis to evaluate the quality of service provided.
- Present a daily trend using an area sparkline to identify dips in satisfaction and correlate them with operational challenges or peak times.
-
Number of Patients Referred:
- Count the number of patients referred to specific departments from the ER each day.
- Use an area sparkline to track daily trends and identify departments with high referral rates, which may require additional resources.
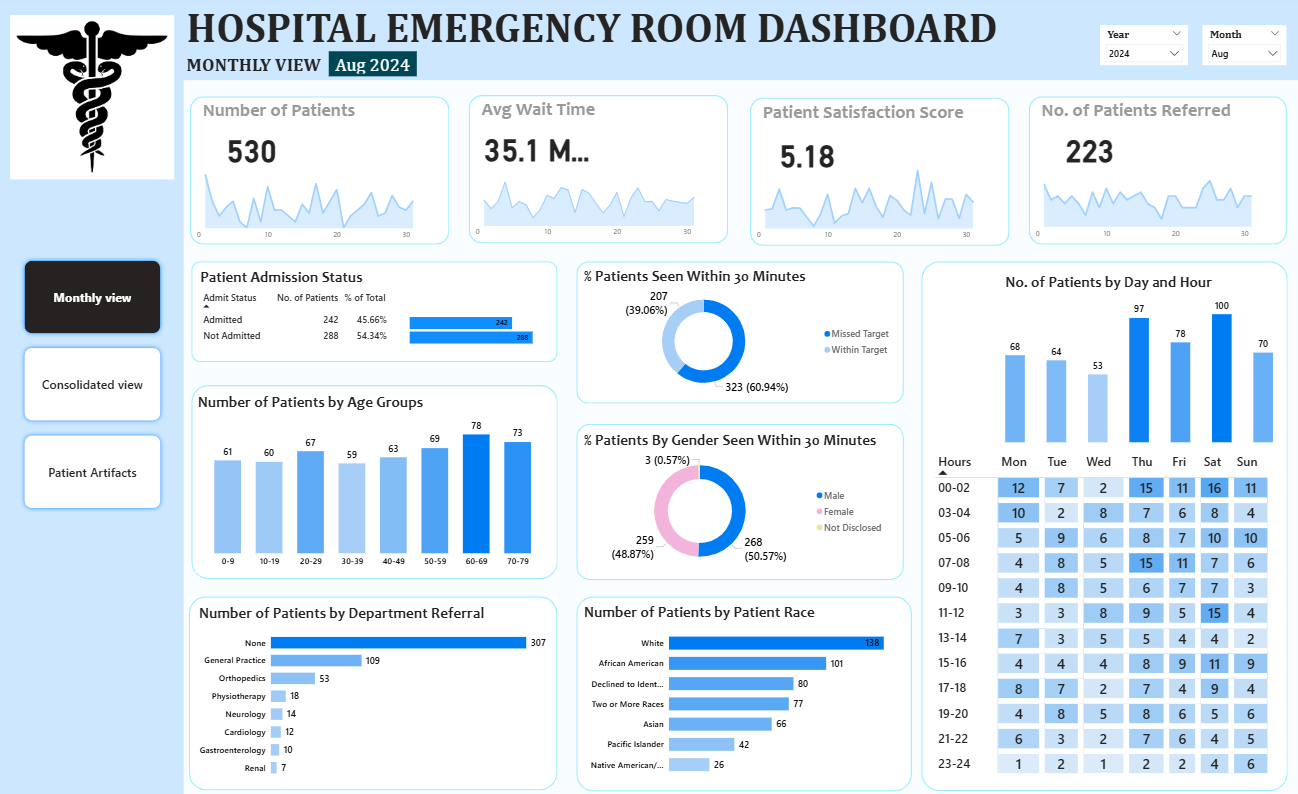
Dashboard 1: Monthly View
Monitor key metrics filtered on date range- Patient Admission Status: Track admitted vs. non-admitted patients.
- Patient Age Distribution: Group patients by 10-year age intervals.
- Department Referrals: Analyze referral trends across different departments.
- Timeliness: Measure the percentage of patients seen within 30 minutes.
- Gender Analysis: Visualize patient distribution by gender.
- Racial Demographics: Analyze patient data by race.
- Time Analysis: Assess patient volume by day and hour.
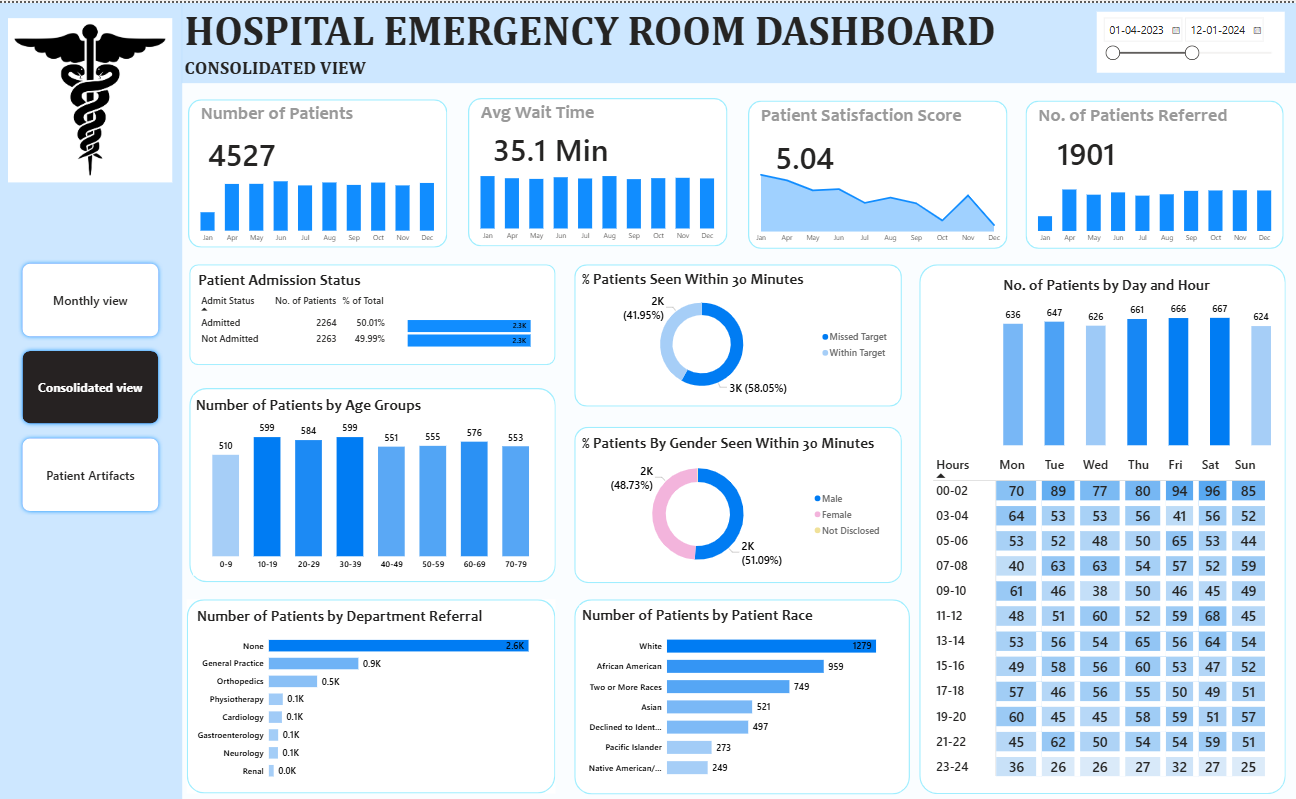
Dashboard 2: Consolidated View
Holistic summary of hospital performance filtered on date range- Similar to Monthly view, but aggregated over customizable date range for broader insights
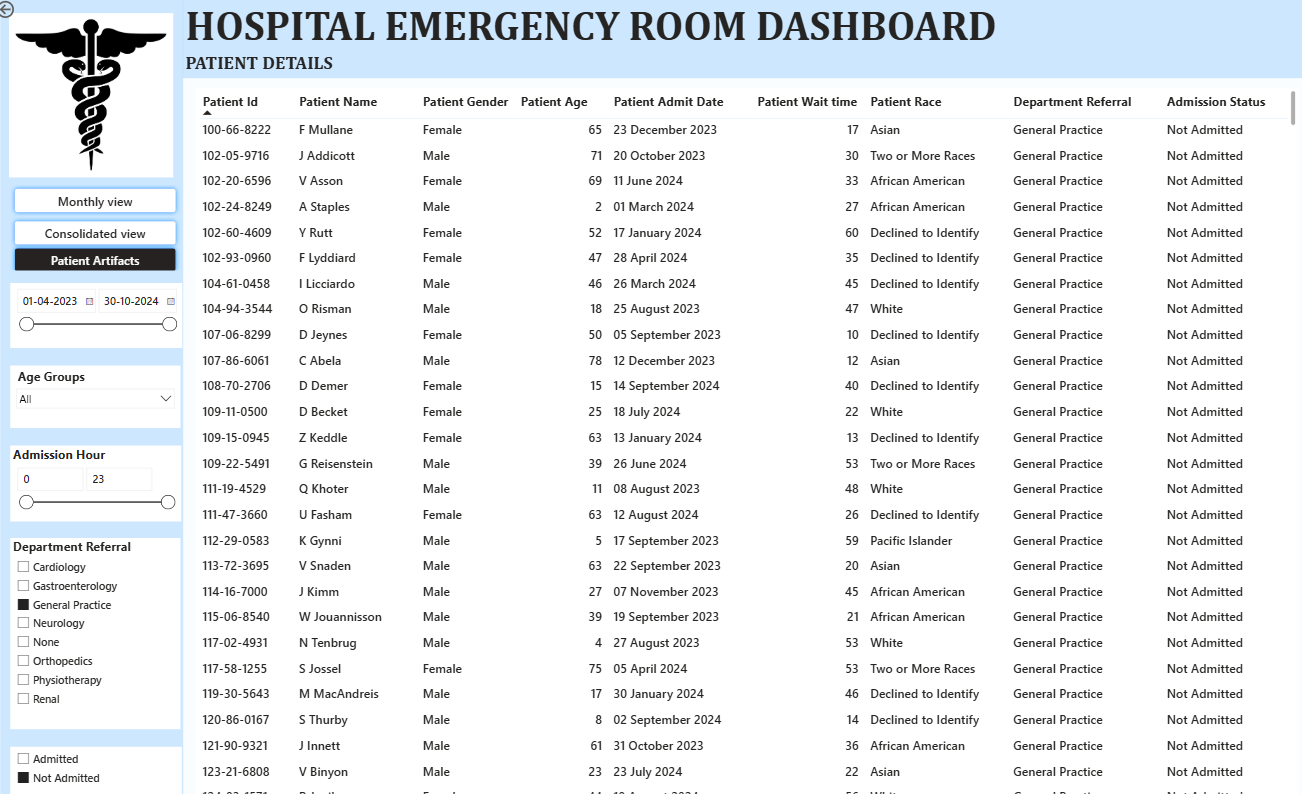
Dashboard 3: Patient Details
Offer granular insights into patient-level data to enable detailed analysis and troubleshooting. Charts to Develop: A grid displaying essential fields like:- Patient ID
- Patient Full Name
- Gender
- Age
- Admission Date
- Patient Race
- Wait Time
- Department Referral
- Admission Status